Chartify
Generating interactive charts and graphs without coding.
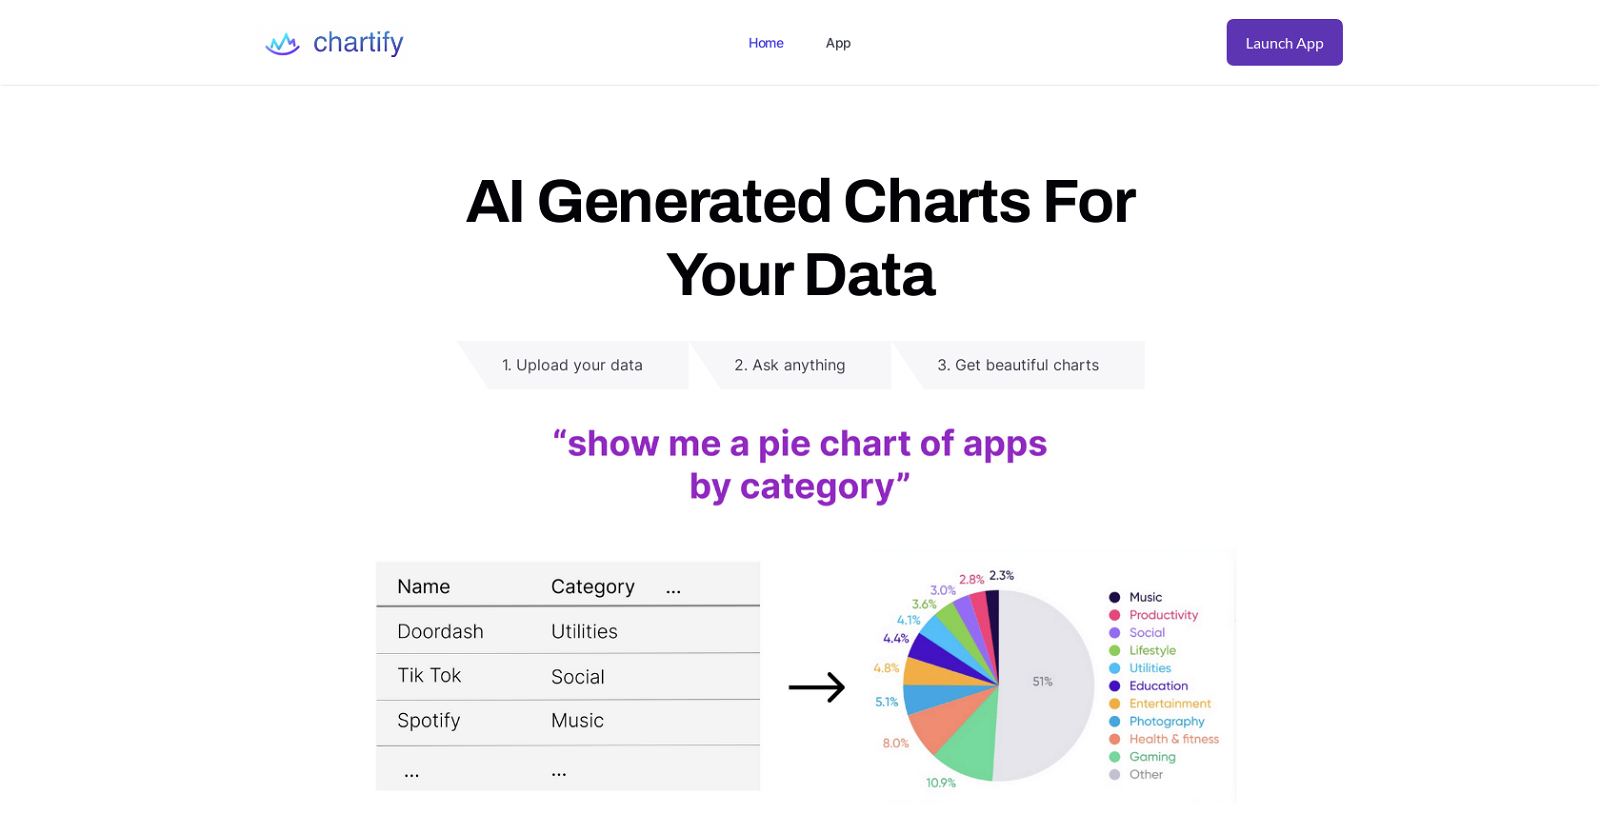
Chartify is an AI-powered tool that makes creating interactive charts and graphs from CSVs and database tables a breeze. This tool eliminates the need for manual coding or using clunky chart editors in Excel and Google Sheets. Instead, users can simply upload their data via CSV, Postgres, or MySQL to get started. Right away, Chartify will offer recommended visualizations based on the data provided, such as pie charts, bar charts, and line graphs. Additionally, users can request their preferred chart type and the AI will generate various options with different styles across Plotly, Matplotlib, Seaborn, and Charts.js.
The intuitive interface of Chartify provides an entirely new way to interact with data by offering a variety of visualizations that allow users to explore insights from all angles. With this powerful tool at your disposal you can quickly generate engaging visuals without needing any prior coding experience or knowledge of chart editors. Overall, Chartify is an excellent choice for anyone looking to create beautiful data-driven visuals with minimal effort.
Would you recommend Chartify?
Help other people by letting them know if this AI was useful.


Authentication required
You must log in to post a comment.
Log in