ChartGPT
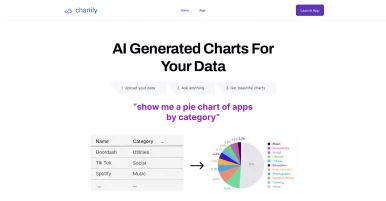
Creates charts from text inputs for visualization.

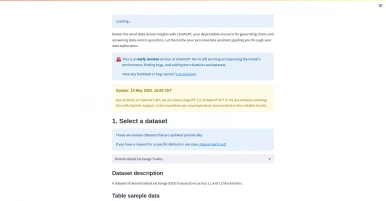
CHARTGPT is an AI-driven tool that automates the process of creating charts from text inputs. It uses React, Next.js, OpenAI, and Tailwind CSS to generate visually appealing charts from user data provided in text form. This saves users time and effort by eliminating the need for manual chart creation processes. OpenAI also ensures accuracy of the generated charts, making it easier to comprehend complex and unstructured data. The output is presented in a beautiful format that makes it easy to share with others.
The tool has a user-friendly interface and is available on GitHub for developers who wish to integrate it into their existing projects. Moreover, its setup process is quick and straightforward. All these features make CHARTGPT a great addition to any data analyst or researcher's toolkit as they can quickly create beautiful charts without having to do any additional work themselves.
Overall, CHARTGPT offers users ease of use and accuracy when creating charts from textual inputs. With its automated process and beautiful graphical output, this tool allows users to save time while still providing accurate visualizations of their data sets. This makes it an invaluable asset for presenters, data analysts, researchers, or anyone else looking for efficient ways to create effective visuals quickly and accurately.
Would you recommend ChartGPT?
Help other people by letting them know if this AI was useful.

Authentication required
You must log in to post a comment.
Log in